Comprehensive NZD/USD Analysis for October 19, 2023
In this comprehensive analysis, Ultima Markets brings you an insightful breakdown of the NZD/USD for 19th October 2023.
Key Takeaways
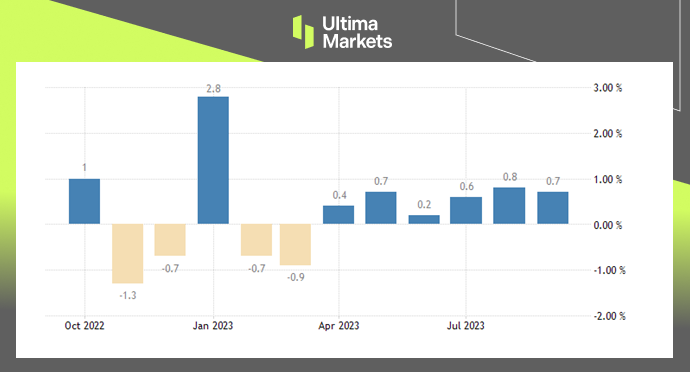
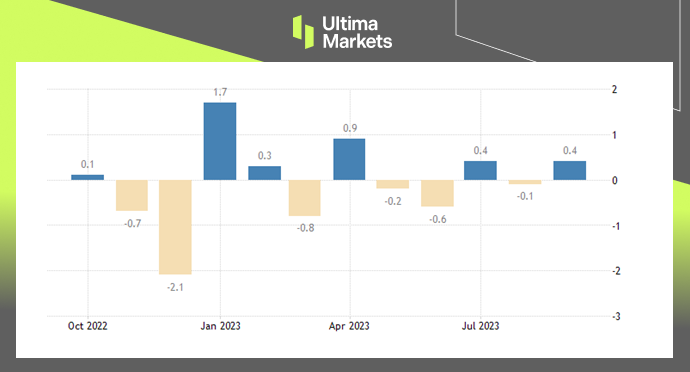
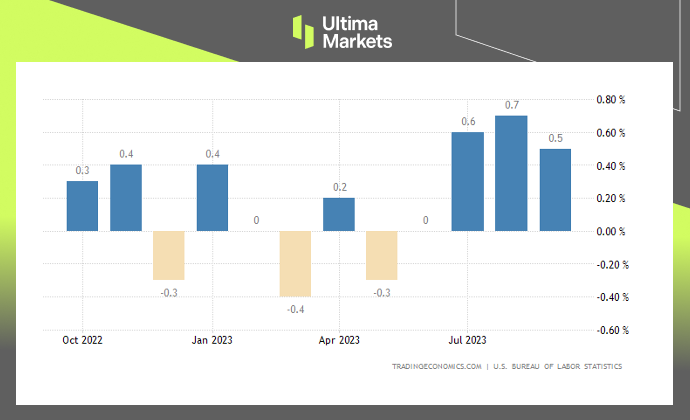
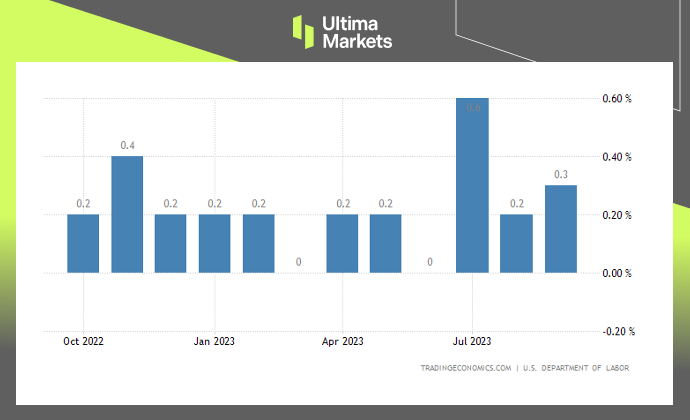
- CPI data lower than expected: The decline in price levels means that the monetary policy of RBNZ is no longer tense. The market expects RBNZ to raise interest rates in February next year instead of November this year.
- Political changes in New Zealand: The opposition National Party won the parliamentary election.
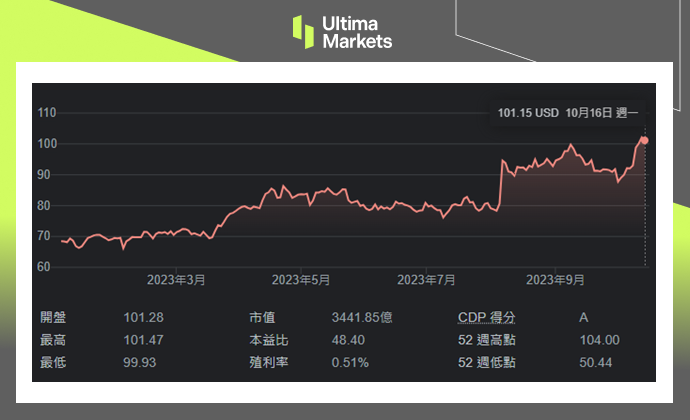
- The U.S. dollar index rose slightly: Federal Reserve Governor Waller changed his tone and said that the Federal Reserve may need to continue to raise interest rates. The U.S. dollar index rose, closing up 0.33% yesterday at 106.58.
NZD/USD Technical Analysis
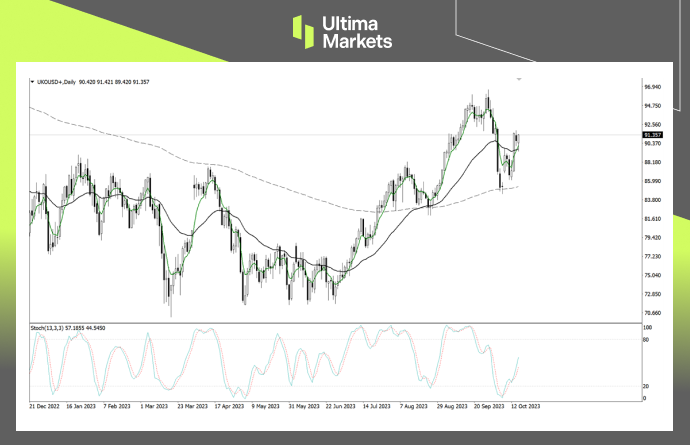
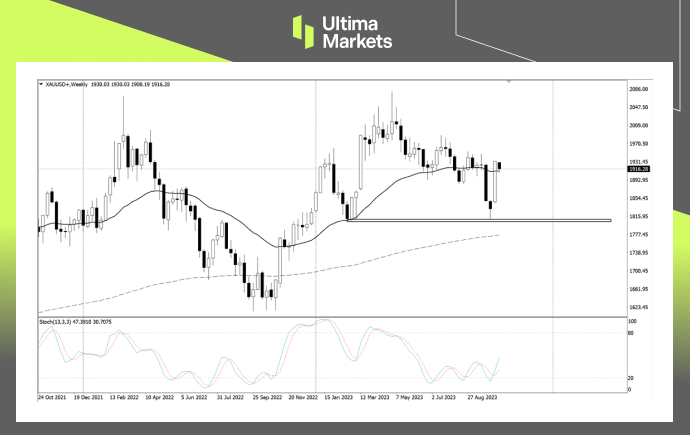
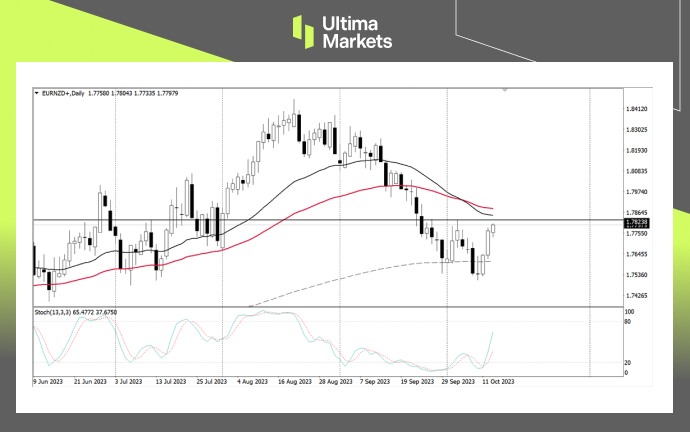
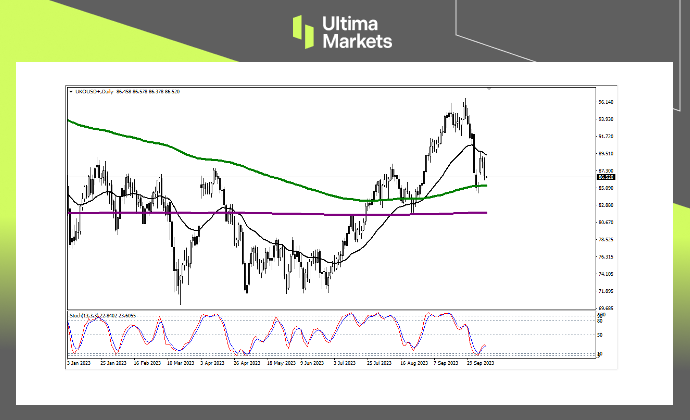
NZD/USD Weekly Chart Insights
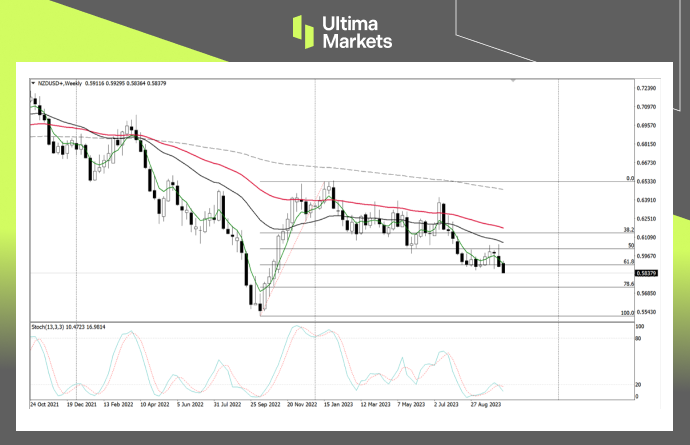
- Price Action: The pin bar last week suggests that the New Zealand dollar’s downward trend is not over yet. The price has fallen below last week’s low price.
- Stochastic oscillator: The indicator once again formed a dead cross in the oversold area, and short-term power prevailed. It is worth noting that due to the weak correction of the exchange rate from September to October, the indicator has the probability of forming a bottom divergence structure. It implies that even if the market falls this week, there is a probability that the price will reverse upward at any time next week.
- Fibonacci retracement ratio: The market began to rise in mid-October last year and began to adjust in January this year. It fluctuated slightly at 61.8%. Since it continues to decline this week, the next target is the Fibonacci retracement price of 78.6%.
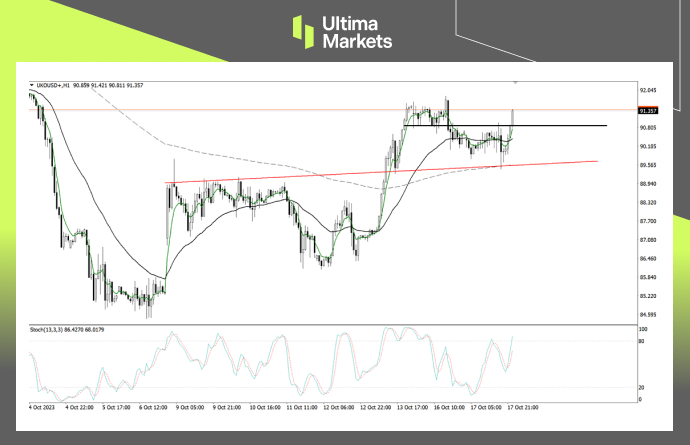
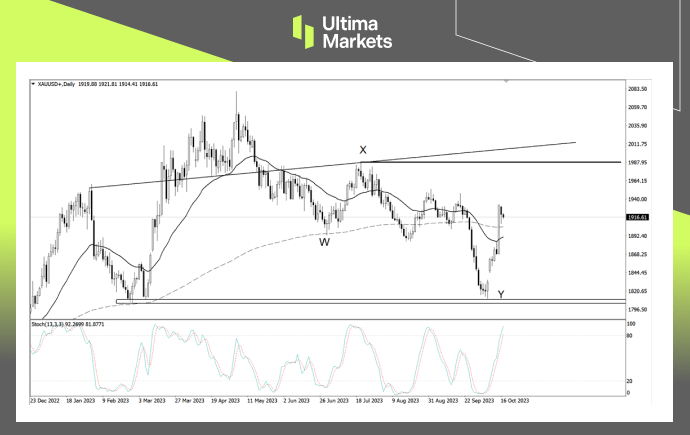
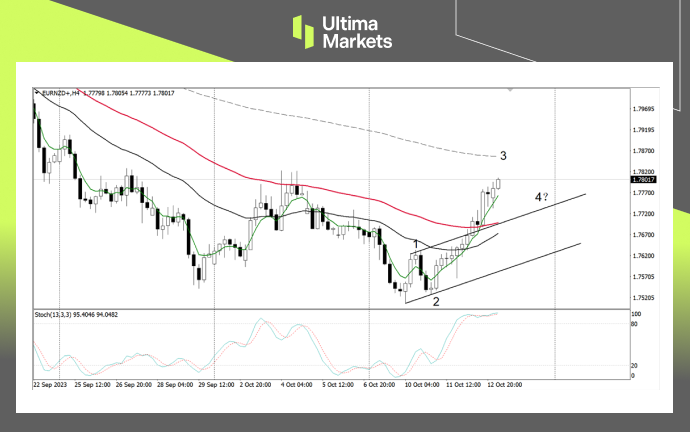
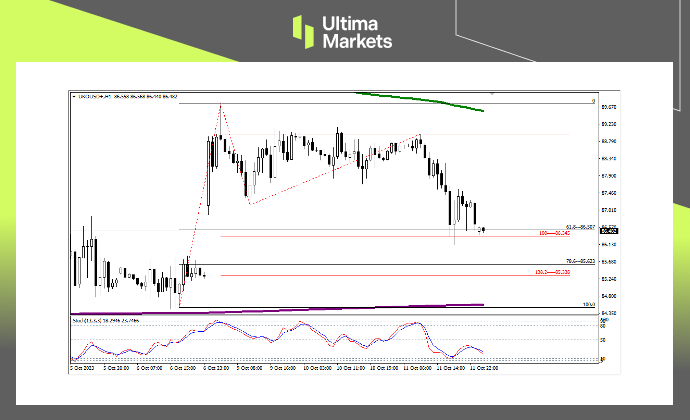
NZD/USD 4-hour Chart Analysis
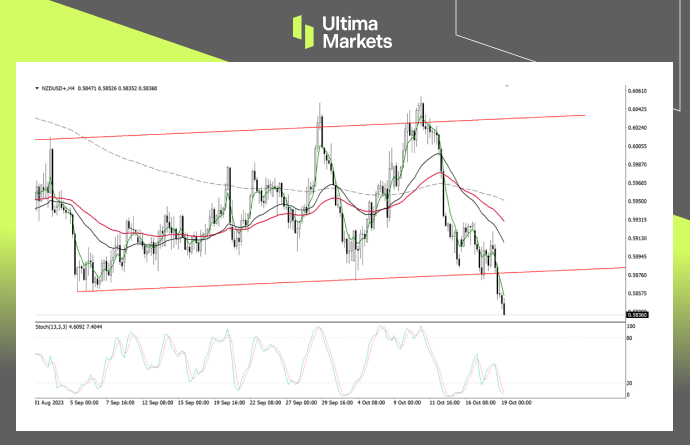
- Upward channel destruction: The entire upward channel line (red) was completely destroyed after yesterday’s rapid decline, and the short intraday trend is strong.
- Price Action: After the market price fell back on the 5-period moving average, it formed a doji structure. Then the exchange rate fell below the low of doji bar, and the short trend was confirmed.
- Stochastic oscillator: The indicator crosses over again in the oversold area. Although shorts are crowded, one cannot take risks by entering the market to buy the dip. If you want to go long, you can only wait until the bull trend is established and then observe.
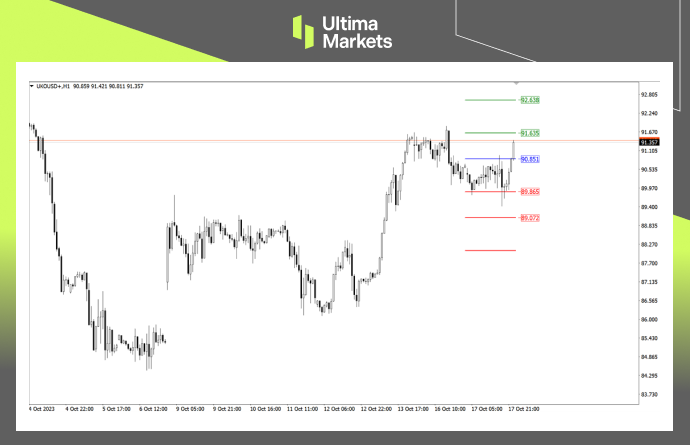
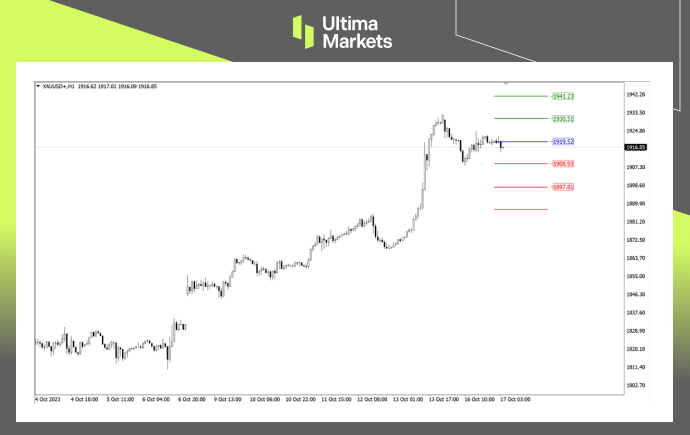
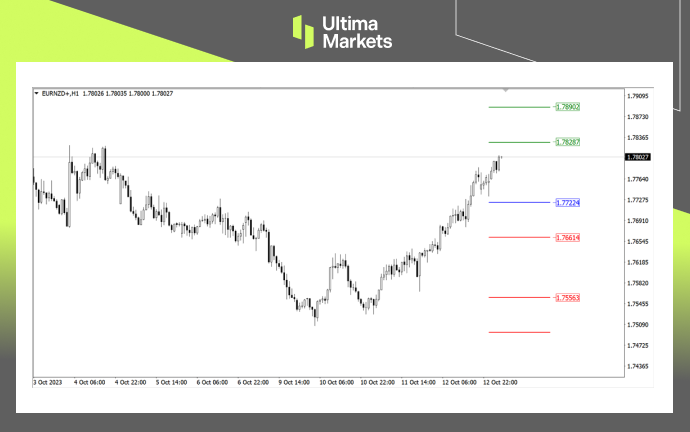
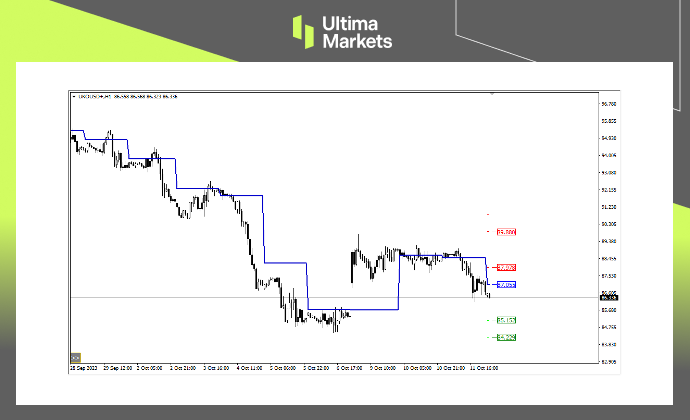
Ultima Markets MT4 Pivot Indicator
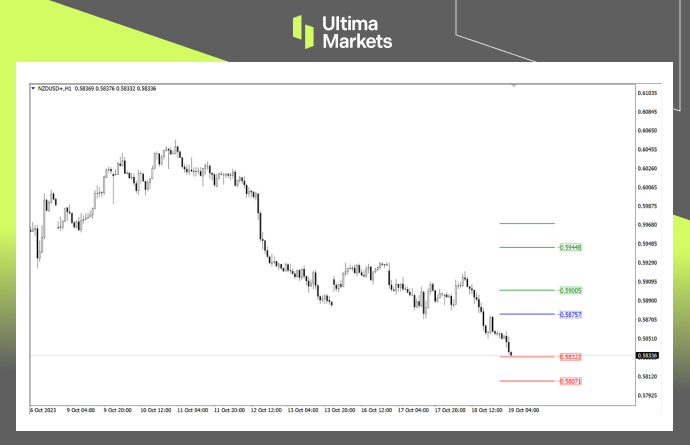
- According to the pivot indicator in Ultima Markets MT4, the central price of the day is established at 0.58757,
- Bullish Scenario: Bullish sentiment prevails above 0.58757, first target 0.59005, second target 0.59448;
- Bearish Outlook: In a bearish scenario below 0.58757, first target 0.58322, second target 0.58071.